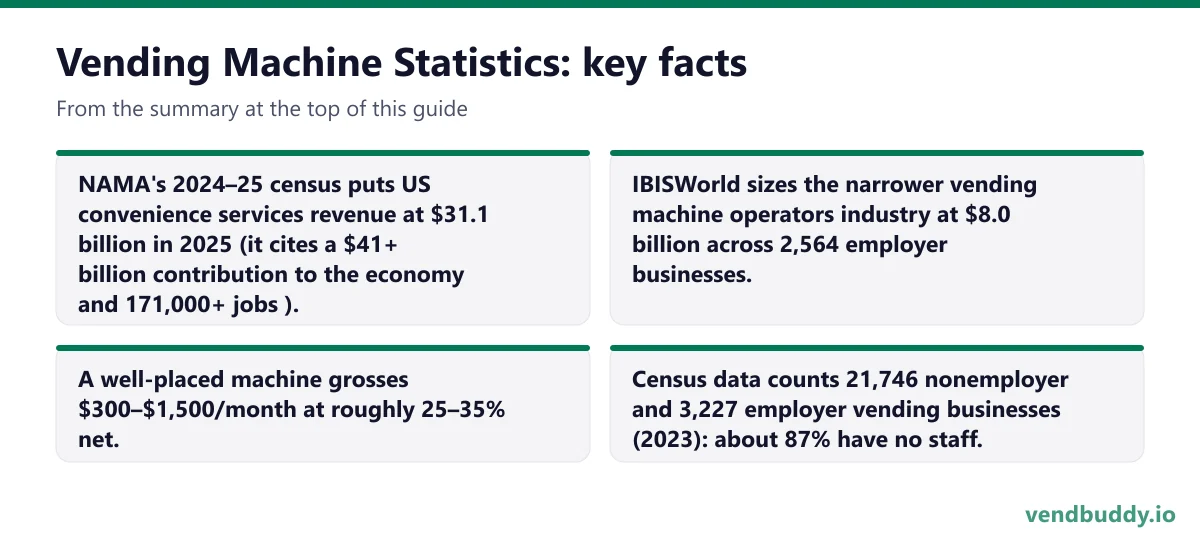
- NAMA’s 2024–25 census puts US convenience services revenue at $31.1 billion in 2025 (it cites a $41+ billion contribution to the economy and 171,000+ jobs).
- IBISWorld sizes the narrower vending machine operators industry at $8.0 billion across 2,564 employer businesses.
- A well-placed machine grosses $300–$1,500/month at roughly 25–35% net.
- Census data counts 21,746 nonemployer and 3,227 employer vending businesses (2023): about 87% have no staff.
- Cantaloupe’s network data puts vending at 78% cashless in 2025, with cashless tickets 59% larger than cash.
- Vending prices rose 4.4% in the year to August 2026 on the BLS CPI, faster than overall inflation.
Last updated 4 October 2026. Nineteen primary-source figures (NAMA census, Census Bureau, BLS, Federal Reserve, RSA, FDA, Cantaloupe, Nayax) added and verified on 4 October 2026; the rest were re-checked on 4 September 2026. Where a number could not be traced to a primary source, it is labelled as an estimate or as VendBuddy operator data rather than presented as a study.
Part of our complete guide: how much do vending machines make.
These statistics are free to use in articles, reports, decks and research with attribution. Every figure below carries a named source and a permanent anchor, so you can deep-link to an individual number.
To cite one statistic, append its anchor — for example .../vending-machine-industry-statistics-2026#s14. If you are quoting an operator-economics figure, please credit it as VendBuddy operator data rather than as an industry study, because that is what it is.
This is a sourced reference of vending machine statistics for 2026. Every number names where it comes from. Market-level figures are attributed to the organisation that published them; operator-economics figures come from VendBuddy operator-reported data and our own published cost and revenue analysis; anything we could not trace to a source is hedged as an estimate instead of dressed up as precision. If you are looking for a single tidy number for “the size of the vending industry,” the honest answer is that it depends entirely on the definition — and the first section explains why.
How to read these numbers
Three labels run through this page and they mean different things. Named-source figures are attributed to the body that published them and were checked against that source in September 2026. VendBuddy operator data means the figure comes from operator-reported numbers and cost breakdowns published across this site — it is real, it is ours, and it is not a peer-reviewed study. Commonly cited estimates are numbers that circulate widely in industry coverage but that we could not trace to a primary source; they are given as ranges and flagged as such. We would rather hand you a range you can defend than a decimal you cannot.
Industry size & growth
There is no single correct number for the size of the vending industry, and any page that gives you one without a definition is guessing. The trade association counts the whole convenience-services category — vending, micro markets, office coffee and pantry service together. Market-research firms typically count a much narrower slice: employer businesses whose primary activity is operating vending machines. Those two definitions are roughly four times apart on revenue, and both are correct within their own scope. The growth picture splits the same way: the narrow vending-operator category has been shrinking, while the broader convenience-services category and its newer formats have not.
- $41+ billion — what NAMA (National Automatic Merchandising Association) says the US convenience services industry contributes to the economy. The category covers vending, micro markets, office coffee service and pantry together. This is an economic-contribution figure; for industry revenue use #s85. Verified on namanow.org, September 2026; wording corrected 4 October 2026.
- $31.1 billion — estimated 2025 revenue of the US convenience services industry, up from $26.6 billion in 2023, an average annual growth of 8.1%, per the NAMA Foundation’s 2024–25 State of Convenience Services census (produced with Technomic, released March 2026). Vending remains the largest business line by revenue and number of businesses. Verified 4 October 2026.
- About 6.5% a year is the growth the same NAMA census projects across all convenience services business lines over the next five years. Verified 4 October 2026.
- 65% of operators cite client requests for healthier product mixes and 59% see better-for-you products as a growth opportunity, per the NAMA census. Verified 4 October 2026.
- 171,000+ jobs supported nationwide by the convenience services industry, per NAMA. Verified September 2026.
- $8.0 billion — 2026 market size of the narrower US “Vending Machine Operators” industry, per IBISWorld. The gap versus the NAMA figure is definitional, not a contradiction. Verified September 2026.
- −1.5% CAGR — IBISWorld reports the vending machine operators industry declining at this compound annual rate between 2021 and 2026.
- −0.5% — IBISWorld’s expected revenue change for the vending machine operators industry in 2026 alone.
- −14.7% — the industry revenue drop IBISWorld records for 2022, the sharpest single-year move in the recent series and the clearest marker of the post-pandemic office-occupancy shock.
- Compass Group and Aramark are named by IBISWorld as the largest companies in the US vending machine operators industry, with Compass Group holding the most market share.
- IBISWorld characterises competition in the industry as “high and steady” — consistent with a market where national players hold the large accounts and independents hold the long tail.
- 3–5 million machines in service across the US is the range commonly cited in industry coverage. We could not trace it to a current primary source, so treat it as a widely repeated estimate rather than a measured count.
- Roughly $18–$30 billion is the range most often quoted for US vending and unattended retail once micro markets and office coffee are included — a commonly cited estimate that sits between the NAMA and IBISWorld definitions. Ranges this wide are a sign the underlying counts are estimates, and should be presented that way.
- 21,746 nonemployer vending businesses (no paid staff) reported $748.4 million in receipts in 2023, about $34,400 each on average, per the US Census Bureau Nonemployer Statistics 2023 for NAICS 445132, Vending Machine Operators. This is the side-income and owner-operator tier that employer-firm counts miss. Verified 4 October 2026.
- 3,227 employer establishments with 40,901 employees and $1.71 billion in annual payroll operated vending machines in 2023, per the Census Bureau County Business Patterns 2023 (NAICS 454210). Verified 4 October 2026.
- About 87% of US vending businesses have no employees: 21,746 nonemployer establishments against 3,227 employer establishments in the two 2023 Census datasets above. VendBuddy calculation from Census data.
- +4.4% in a year: prices for food from vending machines and mobile vendors rose from 259.736 (August 2025) to 271.102 (August 2026) on the Consumer Price Index, faster than food away from home (+3.4%) and all items (+3.4%) over the same months, per BLS CPI series CUUR0000SEFV05. Verified 4 October 2026.
- +34.2% since August 2020 for the same vending CPI series, against +28.9% for all items. VendBuddy calculation from BLS CPI series CUUR0000SEFV05 and CUUR0000SA0.
Picture the machines paying you while you sleep
That’s the real promise of vending — income that doesn’t cost you your time, and a life on your own terms. VendBuddy turns this guide into a step-by-step plan so you actually build it instead of just reading about it. Start free today.
Start building free →Machine economics: cost, revenue & margins
This is the section most people actually came for, and it is where VendBuddy has the most direct evidence: the figures below come from operator-reported numbers and the cost breakdowns published across our own guides. The headline is that per-machine revenue varies far more than per-machine cost. Two operators can buy the same machine for the same money and land four times apart on monthly gross, because the building decides the revenue and the machine only decides the ceiling. The margin, by contrast, is remarkably stable across the industry once the four cost lines are accounted for.
- $300–$1,500 per month gross for a well-placed traditional machine — VendBuddy operator-reported range. Full ranges by scenario in how much vending machines make.
- 25–35% net margin of gross after product cost, commission, card fees and operations — VendBuddy operator data, consistent across location types. See the costs and profit breakdown.
- ~$330 per month net on a solid single machine at a decent location, within a normal range of $150–$400 — VendBuddy operator data. This is the number most first-machine projections get wrong, because they model gross and forget the four deductions.
- $2,000–$4,000 all-in to put one used machine into service (machine, card reader, opening stock, move), versus $4,000–$7,000 all-in new — VendBuddy pricing analysis. Detail in the startup cost guide.
- $300–$1,500 for a private-party marketplace machine, $1,200–$3,000 dealer-refurbished, $3,000–$6,000 new cashless, $5,000–$10,000+ for a smart cooler or AI machine — VendBuddy price bands, in the machine prices buyer’s guide.
- $50–$150 per machine per month is what the average operator spends on repairs when averaged across a full year — VendBuddy operator data. Breakdown in vending machine repair costs.
- Component-level repair costs, VendBuddy operator data: motors $15–$40, compressors $450–$1,050 all-in, control boards $400–$1,200. Compressors and control boards are the two failure modes that end a used machine’s economic life.
- $2–$5 per month in electricity for a non-refrigerated snack machine (roughly 0.5–1 kWh/day), rising to $15–$60 per month for a refrigerated unit at 3–5 kWh/day new or 8–12 kWh/day for an older unit — VendBuddy analysis at a US average retail rate near $0.16/kWh. See vending machine electricity use.
- 8–12 years is the typical first-compressor life on a refrigerated machine; a $300–$600 replacement commonly buys another 8–10 years if the rest of the machine is sound — VendBuddy operator data.
- 3–9 months is the payback window on a well-placed machine, calculated as machine cost divided by monthly net — VendBuddy analysis. Method and worked examples in vending machine ROI and payback.
- 2–3x revenue is the typical uplift from a smart, cashless-first, telemetry-equipped machine over an old combo unit in the same location — VendBuddy operator data. The mechanism is higher-priced SKUs and fewer stockouts, not more footfall.
- ~30% optimistic is how far a typical first-machine projection overstates net profit when it omits commission, card fees, shrink and repairs — VendBuddy analysis of operator projections versus reported results. A six-month projected payback becomes nine or more.
Operator demographics & routes
The defining structural fact of US vending is fragmentation. A handful of national foodservice companies hold the large institutional contracts, and the enormous remainder is served by independents running anywhere from one machine to a few hundred. That is why the market behaves as fragmented rather than saturated, and it is also why the official business counts look so much smaller than the operator population — most independents are non-employer businesses that never appear in an employer-firm count.
- 2,564 businesses in the US vending machine operators industry, per IBISWorld (2026). This counts employer businesses under that industry definition, not the far larger population of one-person and side-income operators. Verified September 2026.
- −1.3% CAGR in the number of those businesses between 2021 and 2026, per IBISWorld — consolidation at the employer end of the market.
- ~6% of the market is held by the largest national operators combined, with everything else run by independents — VendBuddy analysis. This is the concentration figure behind why the market is fragmented rather than saturated.
- 18–40 machines is the route size at which the strongest operators reach six-figure income — VendBuddy operator data. Scale beyond that is a staffing decision, not a revenue one.
- 2–3 hours per week per 5 machines of real service time — VendBuddy operator data. The honest hours picture is in is vending passive income.
- 5 to 15 machines is where most operators make their first hire, triggered when restocking passes 15–20 hours per week — VendBuddy operator data.
- $3–$5 per hour above local market rate is what operators report paying a part-time stocker to get reliability — VendBuddy operator data. Turnover in this role is the hidden cost of scaling.
- A large share of the existing operator base is approaching retirement, putting a steady supply of routes on the market each year — a widely observed industry pattern rather than a measured statistic. It underpins the buy-a-route entry path, frequently with seller financing.
- 20–50% down with the balance paid from the route’s own cash flow is the common structure on seller-financed route purchases — VendBuddy analysis of reported deal terms.
- 1,428 blind vendors operated 1,780 vending facilities on federal and other property in FY 2023 under the Randolph-Sheppard program, which generated $747.5 million, with average vendor earnings of $103,086, per the Rehabilitation Services Administration. Verified 4 October 2026. Context in vending grants and funding.
- 20 machines is the federal threshold for calorie disclosure: operators who own or operate 20 or more vending machines must disclose calorie information for food they sell, per the FDA vending machine labeling rule (final rule published December 2014). Verified 4 October 2026.
Payments & cashless
Cashless acceptance is the single best-evidenced revenue lever in vending, and the one place where a cheap retrofit reliably changes the economics of a machine that is already placed. The pattern operators report is consistent: card acceptance does not merely convert existing cash buyers, it recruits buyers who were never going to carry cash, and it raises the ticket size of the ones who would have. The fees are real and they do not come close to offsetting the lift.
- 30–50% revenue lift within 60 days from fitting a card reader to a cash-only machine — VendBuddy operator-reported data. Comparison of readers and fees in the card reader guide.
- Over 60% lift is commonly reported in gyms, offices and student housing specifically — VendBuddy operator data. These are the youngest, most card-native audiences.
- 15–30% lift even in high-cash markets — VendBuddy operator-reported data. The floor of the effect, not the average.
- 25–35% of sales is what a cash-only machine leaves on the table versus the identical unit with a reader fitted — VendBuddy analysis.
- Above 60–65% of vending transactions are cashless in most US markets, up from roughly half a few years ago — VendBuddy analysis of operator-reported mix. Operators fitting new equipment increasingly report 75%+ of revenue arriving by card or mobile.
- ~$300 up front plus $7–$13 per month for a card reader, plus roughly 5–6% of card sales in processing on typical small-operator plans — VendBuddy cost data. Larger routes negotiate lower.
- $150–$400 per machine to retrofit telemetry and cashless to an existing fleet — VendBuddy analysis. Budget it as acquisition cost, not operating expense.
- 15 to 30 minutes per machine to fit a reader on a standard MDB-compatible machine — VendBuddy operator data. Pre-MDB machines need an adapter board.
- More than 31,000 customers worldwide are claimed by Cantaloupe, one of the two dominant cashless-vending platforms; the company publishes customer case studies citing sales increases in the 9–25% range. Verified on cantaloupe.com, September 2026 — note these are vendor-published figures.
- 78% of food and beverage vending sales were cashless in 2025, up from 73% the year before, across Cantaloupe-connected machines, per Cantaloupe’s Micropayment Trends Report 2026. Verified 4 October 2026. This is vendor network data, and it is higher than the 60–65% operator-reported mix in #s36.
- $2.45 average cashless ticket versus $1.57 cash (+59%) at vending machines in 2025, with an overall average ticket of $2.01, per Cantaloupe’s Micropayment Trends Report 2026. Verified 4 October 2026.
- 85% of cashless vending sales were contactless (tap or mobile) in 2025, up from 78% in 2024, per Cantaloupe. Verified 4 October 2026.
- $3.3 billion was spent at vending machines on Cantaloupe’s network in 2025, up 5% year over year, per Cantaloupe. Verified 4 October 2026.
- 1.463 million managed and connected devices (+16.1%) and 2.873 billion processed transactions (+20.8%) for Nayax in 2025, per its full-year 2025 results. Worldwide figures, not US-only. Verified 4 October 2026.
- 14% of all US consumer payments were made in cash in 2024, against 35% by credit card and 30% by debit card, per the Federal Reserve’s 2025 Diary of Consumer Payment Choice. Consumers still averaged seven cash payments a month, unchanged since 2020. Verified 4 October 2026.
- 45% of payments by adults aged 18 to 24 were made with a mobile phone in 2024, per the same Federal Reserve diary. Verified 4 October 2026. The audience in gyms, campuses and student housing is the one least likely to carry cash.
Product mix & consumer behaviour
Vending demand is unusually stable because the purchase is small, immediate and driven by proximity rather than price. Cold beverages carry the category, and the fastest-growing part of the mix is not a new product type so much as a higher price point — protein, energy and fresh items that a glass-front or smart cooler can hold and a spiral snack machine cannot. The behavioural pattern that matters commercially is that ticket size tracks the audience, not the product.
- Over 70% of vending revenue comes from snacks and cold beverages combined — VendBuddy analysis, consistent with the category structure NAMA and industry coverage describe.
- Cold beverages are the single largest category by sales in the US, ahead of snacks and candy — VendBuddy analysis. Regional detail in best-selling items by region.
- $2.10–$2.80 average transaction at a typical office machine versus $3.20–$4.80 at a gym — VendBuddy operator data. Same margin percentage, larger base.
- $5–$10 average transaction value on smart coolers and micro markets versus $2–$4 on traditional machines — VendBuddy operator data. This is the entire economic argument for the format.
- 60–70% of dollar volume is cold beverages and energy drinks in physical-work settings such as auto shops and warehouses — VendBuddy operator data. Thermoregulation, not preference.
- 15–25% of product cost is a realistic spoilage rate on fresh food in an under-trafficked location — VendBuddy operator data. Above 5% of inventory expiring is the signal to pull the fresh SKUs.
- Below 40% sellthrough marks a SKU for replacement; above 95% means you are running out between service visits and need a higher par level — VendBuddy operating benchmarks.
- Vending demand is recession-resistant: small everyday impulse purchases hold up when larger discretionary spending contracts — a widely observed pattern rather than a measured elasticity. Context in is vending a good business.
- Seasonality is regional, not national: warm markets sell cold beverages year-round and see chocolate become a liability from May to September, while cold-climate markets get a hot-beverage and soup season warm markets never have — VendBuddy operator data.
- $2.01 vending, $3.02 micro market, $4.49 Smart Store: average transaction by self-service format in 2025, per Cantaloupe’s Micropayment Trends Report 2026. Verified 4 October 2026.
- 71 to 572: active Cantaloupe Smart Store locations during 2025, an eightfold increase in one year, per Cantaloupe. Verified 4 October 2026.
Locations & placement
Location explains more of the variance in vending outcomes than every other factor combined, which is why the revenue ranges by property type below are wider than the ranges for any cost line. Headcount, dwell time and whether the audience can leave the building are the three variables that decide the number. Commission is the price of access to the best of those buildings, and it is far more negotiable than new operators assume.
- $8,000–$30,000 per month gross at elite placements — hospitals, universities, mega-warehouses. Rare and real — VendBuddy operator data.
- $3,500–$8,000 per month at warehouses and distribution centres; $2,000–$5,000 at 200+ unit apartment high-rises; $1,800–$4,000 at chain gyms; $1,000–$2,800 at small offices — VendBuddy operator data. Full table in profit by location type.
- $1,000–$2,500 per month net from a single machine at a top location, versus under $150/month net at a poor one — VendBuddy operator data. A sixteen-fold spread on identical hardware.
- Under 50 daily visitors puts a machine in the $200–$500/month gross band — below the threshold where the placement pays for the service trip. VendBuddy analysis; screening method in best vending machine locations.
- 5–10% of gross is standard commission for small and mid-size sites — VendBuddy operator data. Detail and scripts in vending machine commission rates.
- Up to 20% commission is normal at hospitals and hotels; 8–12% of gross is the working national average for mid-size commercial sites — VendBuddy operator data.
- Many premium locations require zero commission — luxury condos and corporate offices frequently want the amenity rather than the revenue share — VendBuddy operator data. Agreeing to 20–30% to “win” a location is the most common negotiating error we see.
- 3–6x the revenue of a single machine in the same footprint is the typical micro market uplift, at a setup cost of $15,000+ — VendBuddy analysis. Comparison in micro markets vs vending machines.
- $8,000–$15,000 per month is routine for a micro market inside a 250+ person multi-shift warehouse — VendBuddy operator data.
- Rules vary by state and city — unattended fresh-food sales trigger food-establishment permits in many jurisdictions, with fees running from a few hundred dollars to roughly $1,100 annually depending on classification. VendBuddy research; state-by-state detail in the state vending law hubs.
Failure & churn realities
Most vending statistics you will find online describe the upside. These describe the other half, and they are the numbers a journalist or researcher usually cannot find anywhere else. The pattern in operator-reported failures is not that the business model does not work — it is that a specific, repeatable sequence of decisions produces the same outcome: buy the machine before securing the location, place it somewhere with insufficient headcount, and discover that a machine cannot be moved cheaply.
- An estimated 50%+ of operators who buy machines before securing locations exit within 12 months — VendBuddy analysis of reported operator outcomes, given as an estimate. Operators who prospect locations first and use written contracts fail at materially lower rates. Full breakdown in why most operators fail in year one.
- 5–10% of locations churn per year for reasons outside the operator’s control — property managers leave, buildings sell, site-wide vending bans appear. VendBuddy operator data; plan capacity accordingly.
- 20–40% per year probability of a significant machine failure event on used equipment, at $400–$1,200 per machine per event — VendBuddy operator data.
- 10–20% per year probability of multiple simultaneous age-related failures across a used fleet over five years old, at $1,500–$4,000 in repair costs — VendBuddy operator data.
- 2–4% shrink is typical in workplace settings — lower than most retail, because employees know each other and consequences are real. VendBuddy operator data.
- Under 2% shrink is what well-designed grab-and-go AI vending typically achieves — not zero, despite the marketing. VendBuddy analysis.
- 12–36% of gross is the combined drag of spoilage plus shrink on a poorly managed route — on a $10,000/month route that is $1,200–$3,600 a month. VendBuddy operator data.
- 80% of reported machine breakdowns are 10-minute fixes — jams, bill validator faults, reader dropouts — VendBuddy operator data. The cost of a breakdown is usually the service trip, not the part.
- $150–$400 to move a machine, before any new location has produced a dollar — VendBuddy cost data. This is the number that makes a bad placement expensive rather than merely disappointing, and the reason the sequencing error at s60 is so costly.
Using and reproducing these statistics
You may quote, chart or reproduce any figure on this page in articles, reports, presentations and research, with attribution to VendBuddy and a link to this page. We ask for two things. First, keep the label attached: a range presented as an estimate should not be reproduced as a precise finding, and an operator-reported figure should not be described as an industry study. Second, if you find a figure here that conflicts with a primary source you have access to, tell us — this page is corrected rather than defended, and the last-updated date at the top moves when it changes.
Frequently Asked Questions
How big is the vending machine industry?
It depends on the definition. NAMA puts the US convenience services industry — vending, micro markets, office coffee and pantry combined — at $31.1 billion of revenue in 2025 (NAMA also cites a $41+ billion contribution to the economy). IBISWorld sizes the narrower “vending machine operators” industry at $8.0 billion for 2026. Both are correct within their own scope, and the roughly four-fold gap is the reason published vending market-size figures vary so widely.
How many vending machines are there in the US?
The range commonly cited in industry coverage is 3–5 million machines in service. We could not trace that figure to a current primary source, so it should be presented as a widely repeated estimate rather than a measured count.
How much revenue does a vending machine make?
A well-placed machine typically grosses $300–$1,500 per month with a net margin around 25–35%, which is roughly $330 a month net on a solid single placement. Elite locations such as hospitals and mega-warehouses can gross $8,000–$30,000 a month. These are VendBuddy operator-reported ranges.
Is the vending machine industry growing or shrinking?
Both, depending on the segment. IBISWorld reports the narrow vending machine operators industry declining at a 1.5% compound annual rate between 2021 and 2026. The newer formats — micro markets, smart coolers, cashless-first equipment — are where the growth in the broader convenience services category is concentrated.
How many vending machine companies are there in the US?
IBISWorld counts 2,564 businesses in the US vending machine operators industry as of 2026, declining at a 1.3% annual rate since 2021. That figure counts employer businesses; the population of independent and side-income operators who are not employers is substantially larger and is not captured by employer-firm counts.
Can I cite these statistics?
Yes, with attribution to VendBuddy and a link to this page. Each statistic has a permanent anchor so you can link to an individual number. Please keep the source label attached — named-source figures, VendBuddy operator data and commonly cited estimates are three different levels of evidence and should not be flattened into one.
Averages are a starting point, not a forecast. VendBuddy scores real buildings near you by traffic, headcount and category, hands you the best contact on file for each, and models net profit and payback with your own numbers before any money moves. Free to start, 5 credits, no card.
What is selling, which buildings say yes, and the numbers before you buy a machine. Free, confirm from your inbox, unsubscribe in one click. Refer one friend and get 25 VendBuddy credits.
General information, not legal, tax or financial advice. Rules change, so check the official source. Revenue and income figures are examples, not promises. See our terms.